Curtailment is already in your P&L. Now you can see it.
Curtailment Is Already in Your P&L. Now You Can See It.
7 min read
When grid constraints require a renewable asset to be redispatched and its output reduced, the resulting curtailment usually reflects system-level conditions rather than any limitation in the asset or its investment case. In high renewable markets like Germany, curtailment can be a routine operational feature. Thus, the question is not whether curtailment will occur, but how much, when, and what it means for a project’s location and returns. If it is not assessed upfront, its impact can emerge later as an unexpected risk to revenues, cash flows, and overall investment performance.
Re-Twin brings location-specific curtailment directly into investment analysis, alongside the revenue, generation, and cash-flow metrics you already rely on. This allows you to incorporate curtailment into your business case from day one, rather than discovering its impact after the investment has been made.
You already know the basic mechanism: grid congestion restricts how much electricity a renewable asset can deliver. When the grid cannot absorb the available generation, the grid operator issues a redispatch instruction and the plant temporarily reduces its output. The challenge is not understanding how curtailment works — it is knowing where it happens, how often it occurs, and what it means for the investment case of a specific site.
A wind farm in Prignitz and one in the Allgäu may look identical in a spreadsheet, yet face completely different grid realities. National averages hide the differences that matter. When curtailment is visible at the level of the actual grid cell, it moves from an unknown risk to a measurable input — one that can be evaluated alongside weather, prices, and generation assumptions.
Curtailment is not evenly distributed across Germany. Two projects in different locations can face completely different levels of grid congestion, with a direct impact on expected generation and financial performance. Understanding the local grid context is therefore an important part of evaluating a renewable asset.
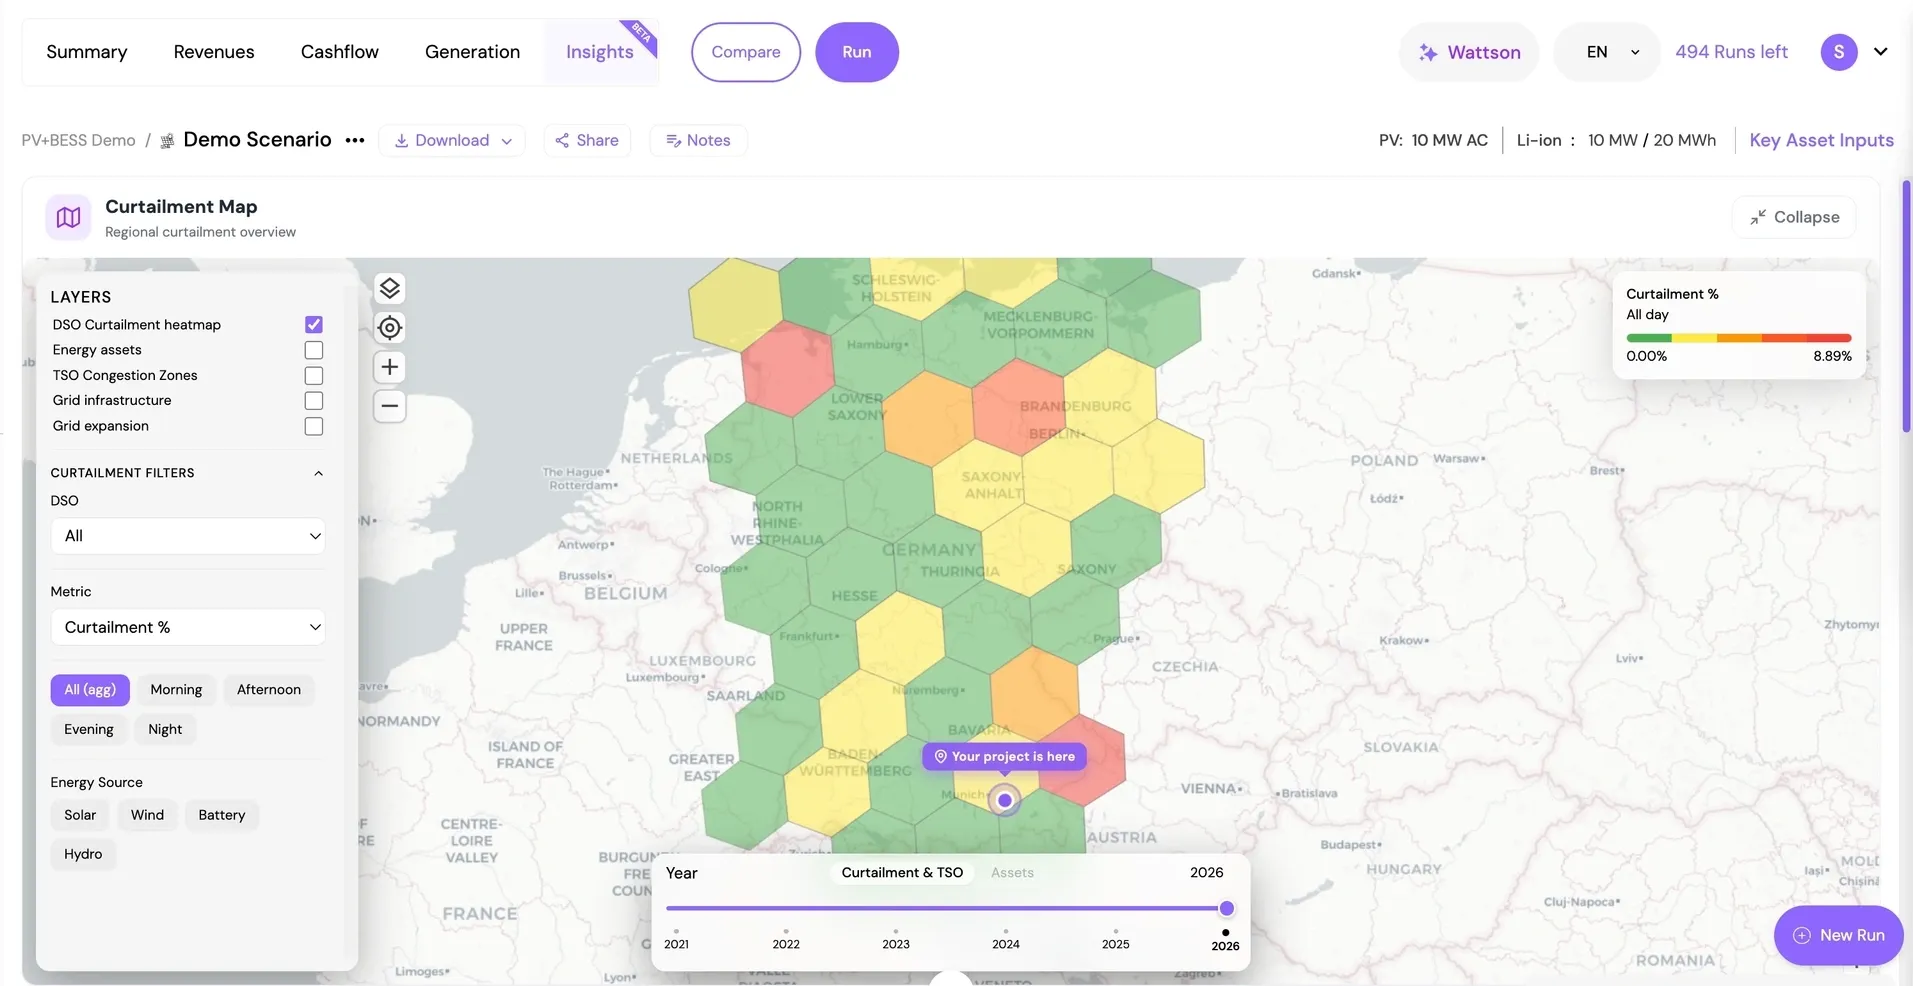
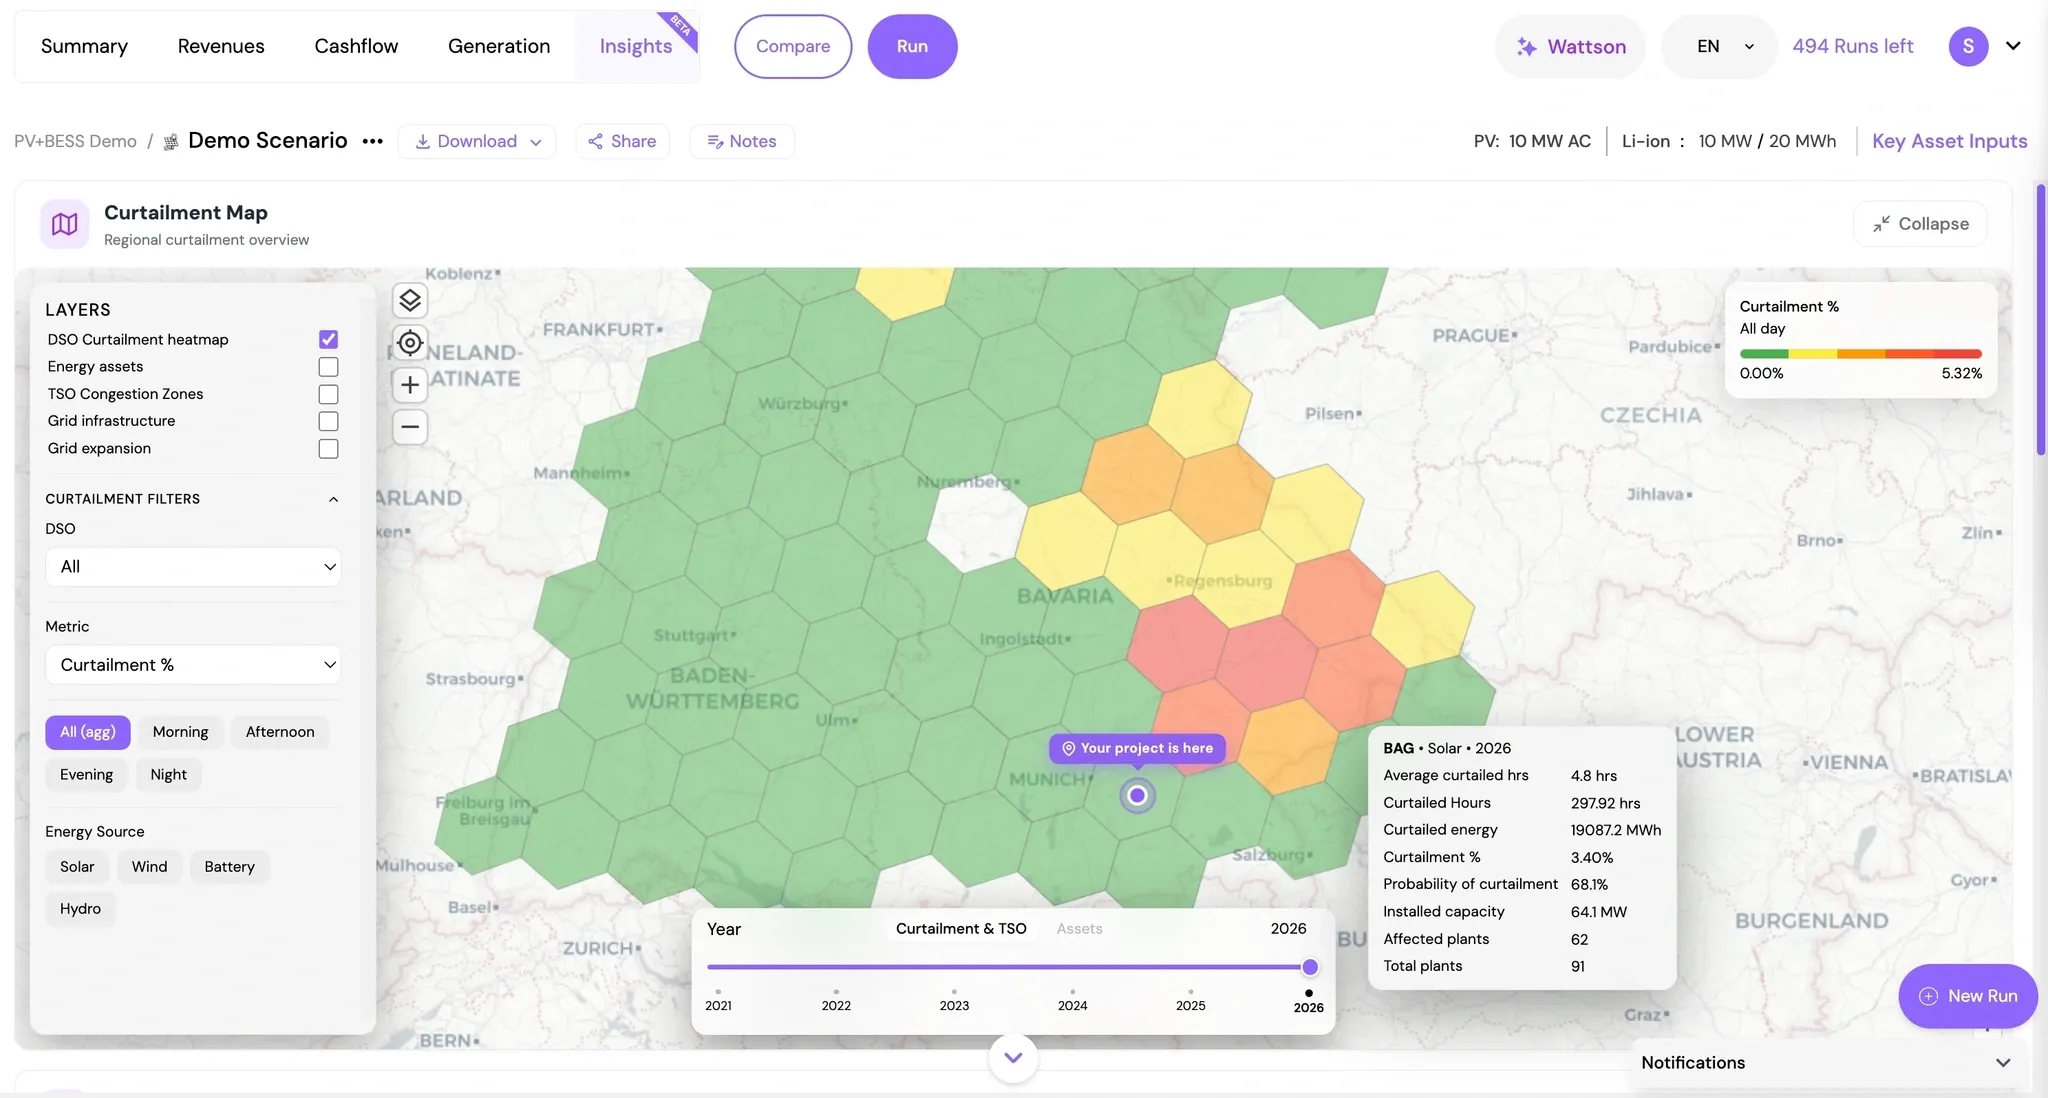
The Curtailment Map provides a regional overview of redispatch activity, showing where curtailment has historically occurred and how it varies across locations. The map is broken down into small hexagonal zones, with your project pinned in context (your asset location is highlighted with a purple marker). Zoom out for the broader picture across the country, or zoom in to the immediate area surrounding your site. The color scale shows the level of curtailment in each zone (green indicates little to no curtailment, while red highlights areas with higher curtailment levels). A timeline at the bottom of the map allows you to see how the curtailment profile has changed year over year (located at the bottom center of the view).
This allows you to quickly identify whether a target site sits in a low-congestion area or a location that requires closer investigation — helping you factor grid conditions into the investment case before they become a surprise later.
Curtailment is not only about where it happens — timing matters just as much. A site that experiences occasional curtailment at random hours has a very different investment profile from one where curtailment consistently occurs during the same periods. Understanding this hourly pattern is key to assessing the impact on generation and identifying potential opportunities.
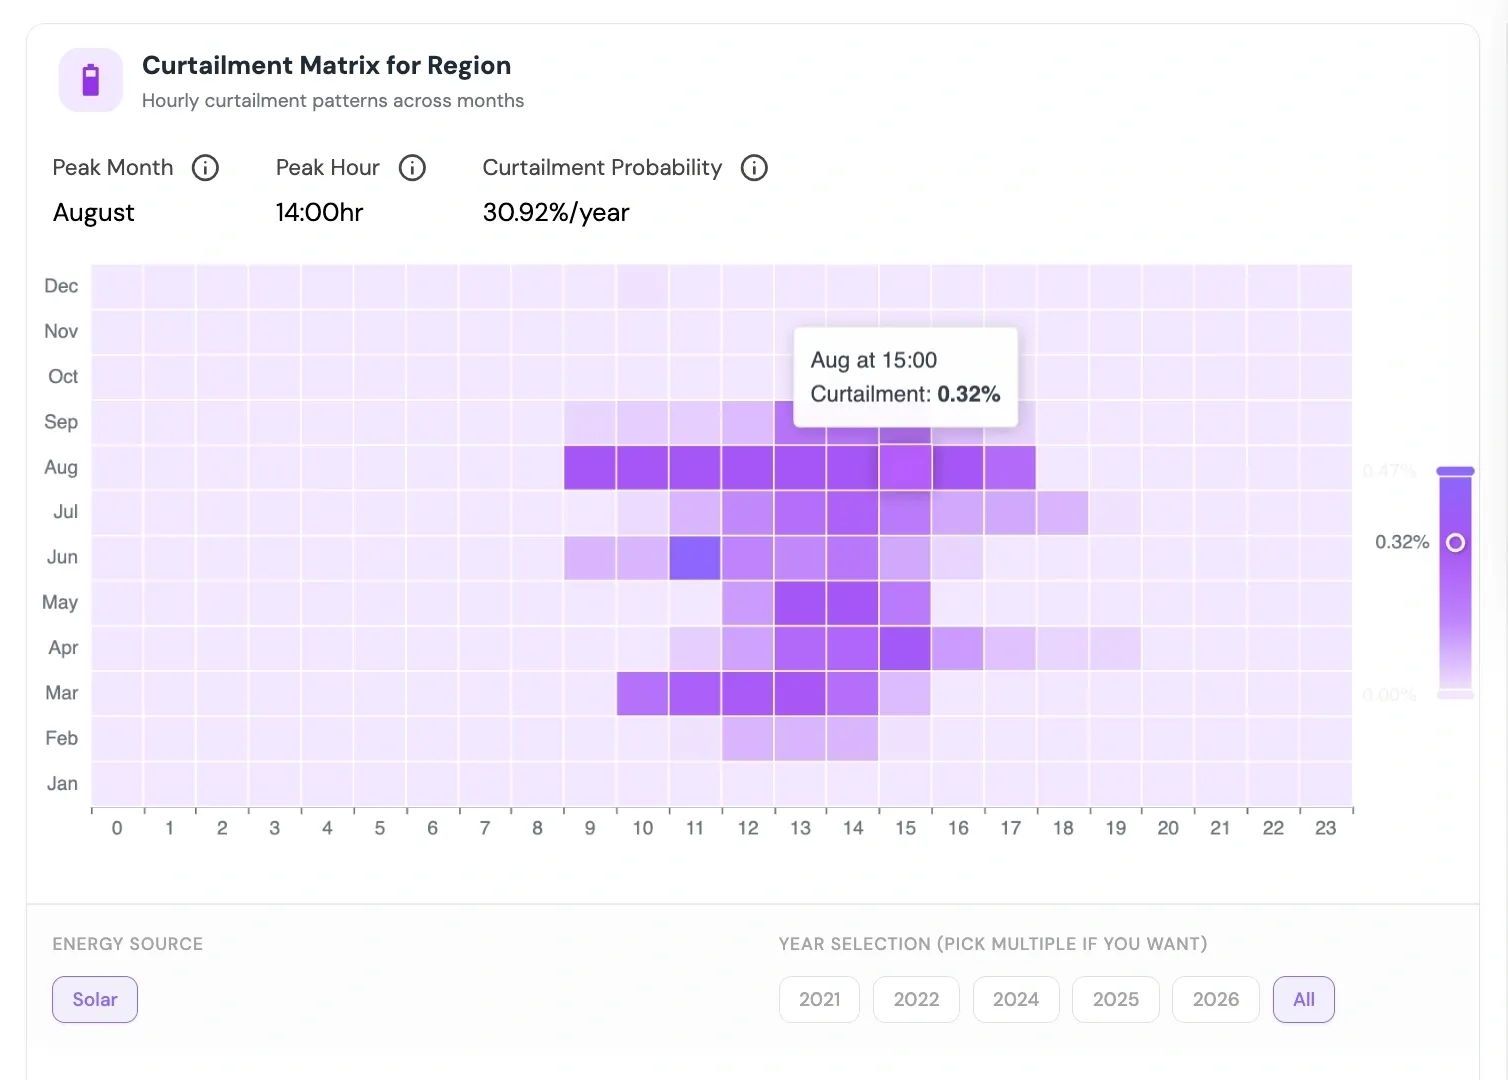
The Curtailment Matrix is automatically calculated for the exact site you are evaluating when you run a scenario in Investment Analysis. It shows the hourly curtailment pattern across every month and year, including Peak Month, Peak Hour, Curtailment Hours, and Curtailment Probability (%) for that specific location.
In the example above, a solar generation site reaches its peak curtailment in August around 15:00 (highlighting the midday hours when solar generation is typically at its highest).
This timing pattern is where additional value can emerge. If the grid is consistently reducing generation during the same hours, the curtailed energy represents a predictable source of available power that can be shifted to higher-value periods. The Curtailment Matrix helps determine whether co-located storage makes economic sense and supports sizing decisions based on when and how frequently redispatch occurs, rather than relying only on merchant arbitrage assumptions.
Curtailment is not static. Grid conditions change over time as renewable capacity grows, demand patterns shift, and network infrastructure evolves. A site that appears low-risk today may face increasing congestion in the future, making it important to understand how the local curtailment profile is developing over time.
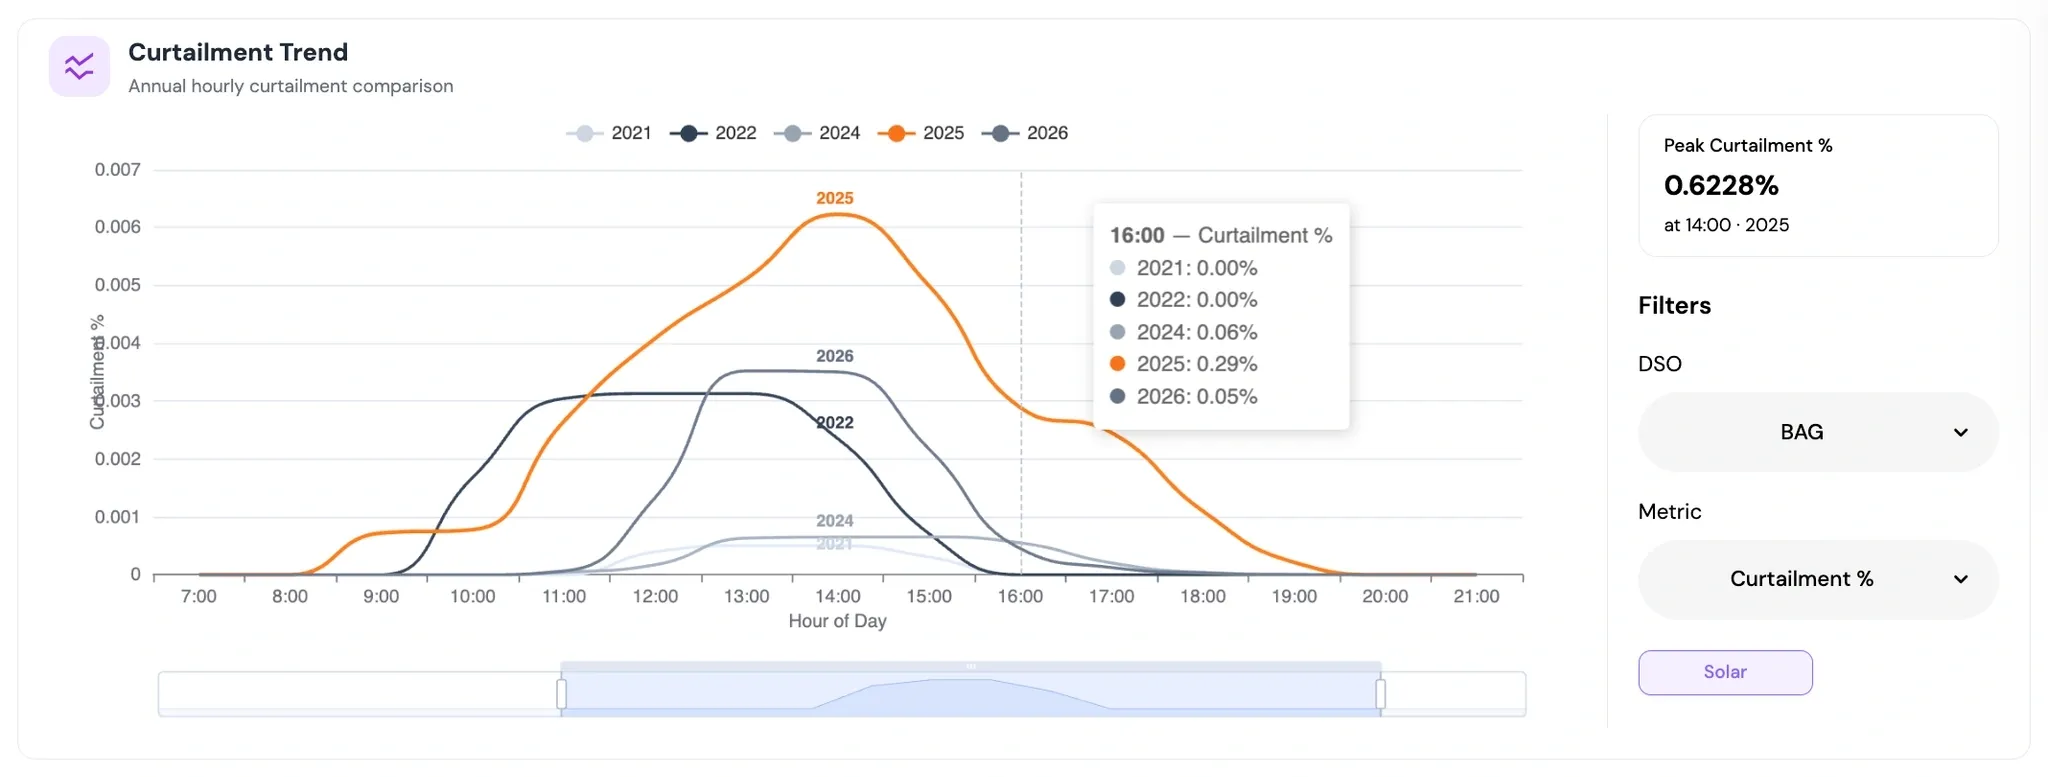
The Curtailment Trend shows how curtailment has evolved year on year for the Distribution System Operator (DSO) area where your asset is located. The view is automatically linked to your scenario location and plots the annual hourly curtailment profile, allowing you to see whether congestion in the region is improving or worsening.
Continuing the same example, a PV site’s curtailed volume during midday hours increases from effectively zero in 2021–2022 to a 2025 peak above 20 MWh.
This trend helps identify whether curtailment is becoming a growing risk or a potential opportunity. A rising curtailment profile can highlight where storage may create additional value, while also allowing investors to incorporate evolving grid conditions into their assumptions rather than relying only on historical performance.
The Curtailment Matrix and Curtailment Trend are both region-specific — linked to the DSO and grid cell where your asset is located — and cover all four renewable classes: solar, wind, storage, and hydro.
The same map also includes additional layers alongside curtailment — operational and planned energy assets, existing grid infrastructure, and grid expansion plans — providing further context for site evaluation. We will explore these additional layers in more detail in a separate post.
Revenue modeling: use regional curtailment history to build a location-specific, evidence-based view of P50/P90 generation, rather than relying on flat industry averages that hide the local differences that matter.
Site screening: before commissioning a detailed grid study, check whether the target cell already has a history of redispatch. That history is valuable information in itself. It shows where connection capacity may become a constraint and helps you decide where deeper analysis is needed before committing time and capital. What previously took weeks can now be assessed in minutes.
The storage case: persistent, hour-concentrated curtailment is one of the clearest signals that a battery has a genuine, structural reason to exist in that location — not as a workaround for a grid constraint, but as a business case in its own right. The Curtailment Matrix and Curtailment Trend together show not just if curtailment occurs, but when and how deep it is. Combined with day-ahead forecasting, they allow you to model both the curtailment that storage can absorb and the arbitrage revenue it can generate on the same asset.
An additional note on why the timing matters now: Germany’s economy ministry has proposed a measure — informally known as Redispatch-Vorbehalt — that could allow grid operators to withhold curtailment compensation in already congested zones. This measure is part of the broader EEG 2027 reform and is still moving through the legislative process, so nothing is final yet. If introduced, curtailment would no longer simply be reimbursed; in some locations, it would become a cost to factor into the investment case, while in others it could make co-located storage economically attractive. Either way, these three views are designed to identify that location-specific variance early — not years into a 20-year asset lifecycle.
Re-Twin combines multiple energy datasets and analytical models to turn fragmented grid information into an investment-ready curtailment view. We gather DSO redispatch measure data — the official down-regulation records — and join it with Germany’s renewable master data register (MaStR) and hourly weather data. The combined dataset is then spatially indexed so curtailment can be analyzed at the relevant cell, region, and DSO level.
The result is a location-specific view of curtailment, expressed through metrics such as Curtailment % and Curtailed Hours for the exact area where your asset is located. The analysis is rerun as new DSO data becomes available, ensuring the curtailment view reflects the latest grid conditions, and is integrated directly into the same platform where you evaluate generation, revenues, and cash flows.
The outcome is that curtailment becomes part of the investment analysis itself. Instead of being a separate grid study or a regulatory data point reviewed later, it becomes a measurable input you can assess alongside revenues, cash flows, and generation when building your business case.
Curtailment integrated into Investment Analysis: our next step is to bring the curtailment signal directly into revenue and cash flow modeling, so location-specific adjustments are automatically reflected in the investment case rather than interpreted manually from the map.
More markets, the same level of insight: curtailment data is currently available for Germany and Spain, with the Netherlands, Belgium, and Austria coming next.
Curtailment forecasting: moving beyond historical patterns to provide a forward-looking view of curtailment risk.
Deeper German DSO coverage: expanding coverage within our largest market to provide even more granular regional insights.
We are putting these views in front of the people who develop, finance, and optimize renewable assets to understand what is most valuable, where the analysis can go further, and what insights you need next.
If you have feedback, would like to learn more, or would like a demo, contact us. If you are already using the Re-Twin platform, run a scenario in Investment Analysis and then open the Insights tab in your results and explore the curtailment views.
About the Author
Siddharth Tambat
Siddharth Tambat is a Senior Data Engineer specializing in cloud-native data platforms, scalable ETL/ELT pipelines, and modern data architectures. His work focuses on designing high-performance data engineering solutions that power analytics, business intelligence, and machine learning across leading cloud platforms. With expertise in building reliable, efficient, and scalable data systems, he is passionate about enabling organizations to unlock the full value of their data through automation, optimization, and data-driven innovation.
Ready to Transform Your Energy Strategy?
Unlock the full potential of your energy assets with Re-Twin Energy's cutting-edge Analytics & AI platform